39478 Real Estate and Homes for Sale
17 results
Sort:
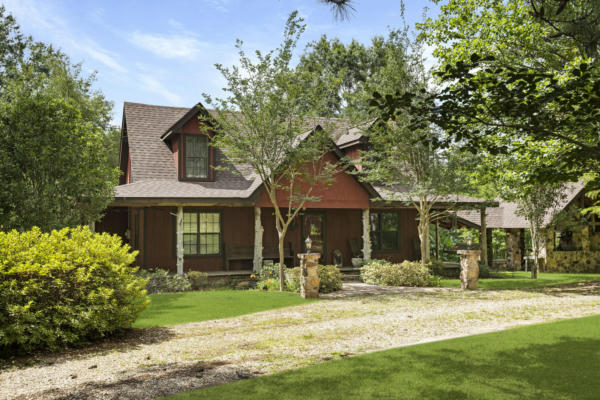
231 MOUNT BETHEL RD, SANDY HOOK, MS 39478
$650,000
1Beds
1Baths
N/ASq Ft
Listing by Dunbar Real Estate Inc.
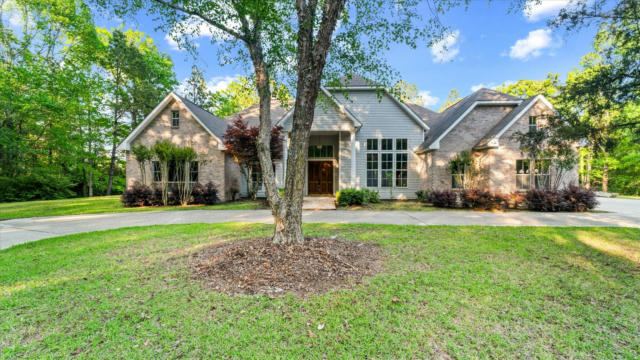
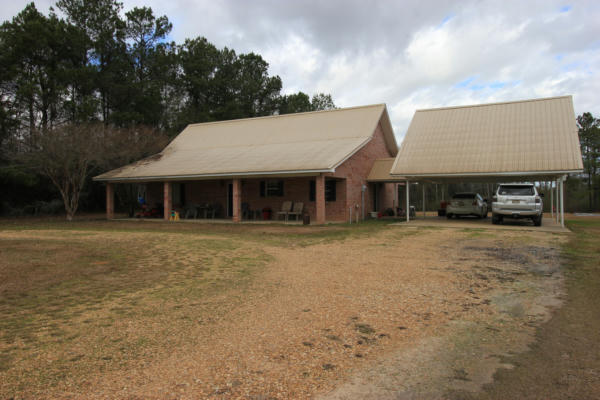
128 SPRING HILL CHURCH RD, SANDY HOOK, MS 39478
$450,000
4Beds
4Baths
4,200Sq Ft
Listing by Doug Rushing Realty, Inc
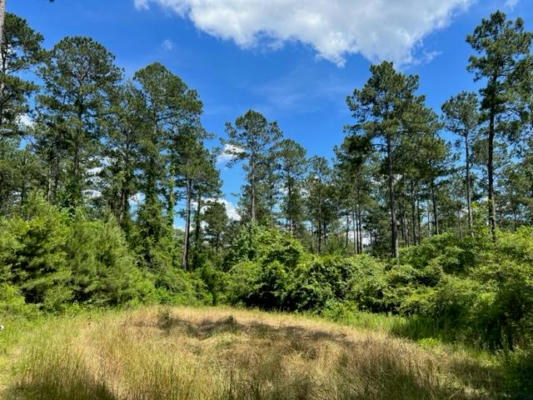
000 OLD STATE LINE ROAD, TYLERTOWN, MS 39667
$425,000
-Beds
0Baths
N/ASq Ft
Listing by Pursuit Properties, LLC – Jason Murtagh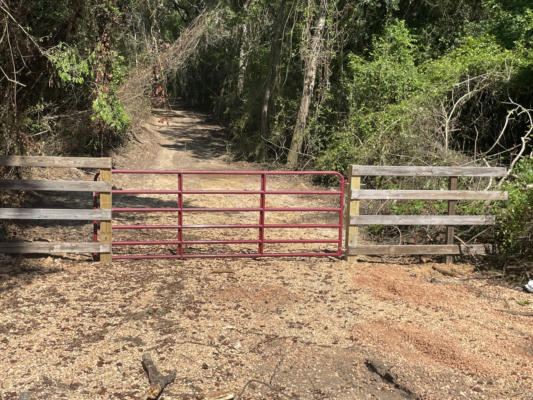
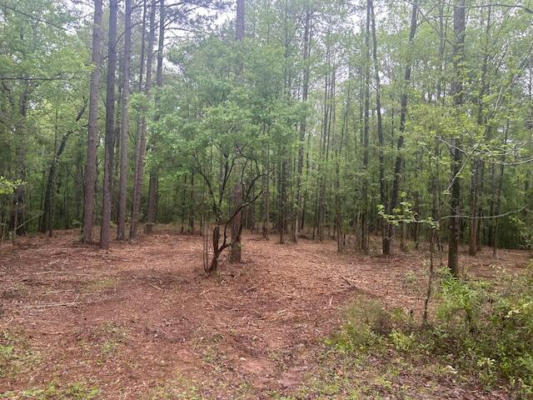
0 SON THOMPSON, SANDY HOOK, MS 39478
$59,500
-Beds
0Baths
N/ASq Ft
Listing by River Ridge Properties, LLC
00 FRAZIER HILL LANE, SANDY HOOK, MS 39478
$42,000
-Beds
0Baths
N/ASq Ft
Listing by Real Broker, LLC. – Beau Davis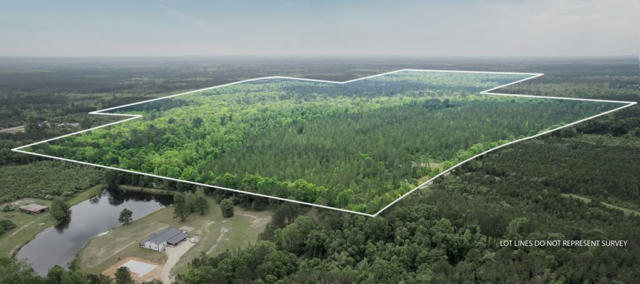

128 SPRING HILL CHURCH RD, SANDY HOOK, MS 39478
$450,000
4Beds
4Baths
4,200Sq Ft
Listing by Doug Rushing Realty
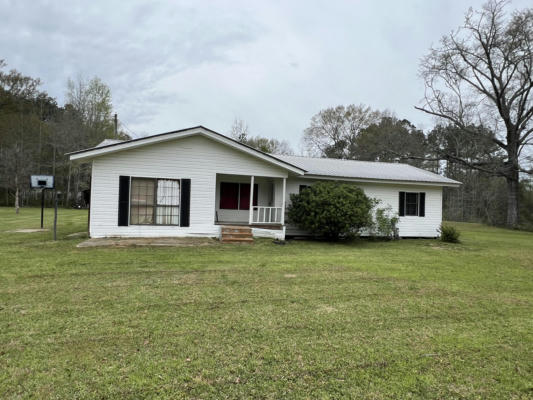
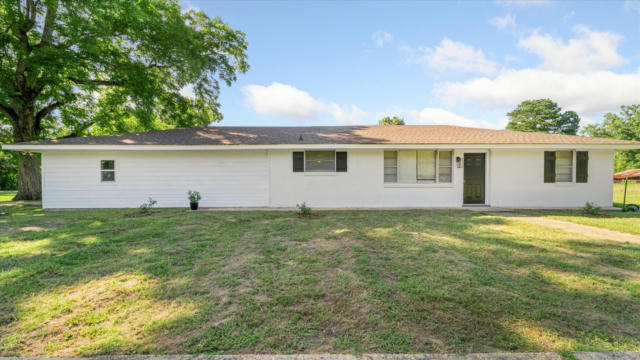
545 SAINT PAUL RD, SANDY HOOK, MS 39478
$75,000
3Beds
2Baths
1,344Sq Ft
Listing by Tanya Holland Real Estate LLC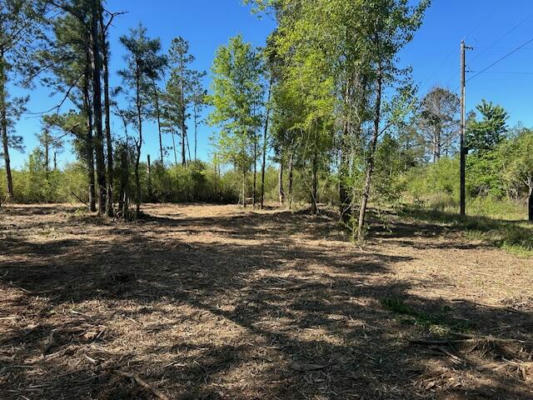
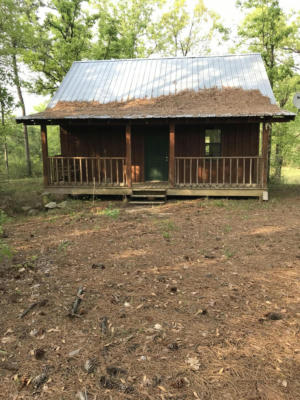
36 CHERAMIE RD, SANDY HOOK, MS 39478
$215,000
3Beds
2Baths
2,400Sq Ft
Listing by RE/MAX Real Estate Partners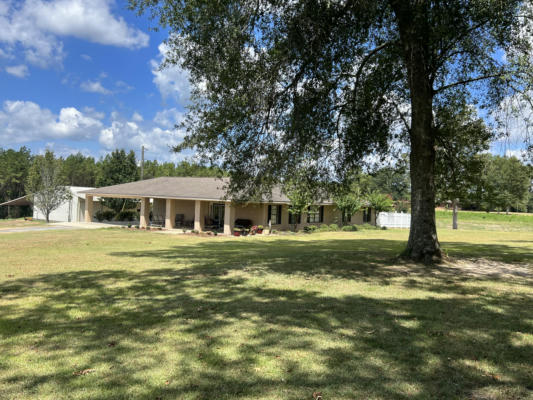
41 HURRICANE CREEK CHURCH RD, SANDY HOOK, MS 39478
$375,000
3Beds
2Baths
2,860Sq Ft
Listing by Tanya Holland Real Estate LLC
E STATELINE ROAD, SANDY HOOK, MS 39478
$168,499
0Beds
0Baths
N/ASq Ft
Listing by Coldwell Banker Key Realty

00 ADA MARK RD., SANDY HOOK, MS 39478
$55,000
-Beds
0Baths
N/ASq Ft
Listing by Richton Tie And Timber Llc
| Cities | Total Listings | Avg. List Price |
|---|---|---|
| 1. Gulfport, MS | 1,134 | $260,985 |
| 2. Jackson, MS | 777 | $154,863 |
| 3. Biloxi, MS | 759 | $311,601 |
| 4. Bay Saint Louis, MS | 661 | $215,242 |
| 5. Brandon, MS | 652 | $306,581 |
| 6. Ocean Springs, MS | 634 | $289,346 |
| 7. Oxford, MS | 596 | $600,325 |
| 8. Madison, MS | 568 | $489,411 |
| 9. Hattiesburg, MS | 530 | $285,182 |
| 10. Olive Branch, MS | 458 | $407,056 |
Total Listings and Average List Price are calculated by RE/MAX, LLC based on active residential listings provided by relevant MLS boards. While MLS data is believed to be reliable, it cannot be guaranteed. MLS data is constantly being updated, making any analysis a snapshot at a particular time.