12919 Real Estate and Homes for Sale
25 results
Sort:
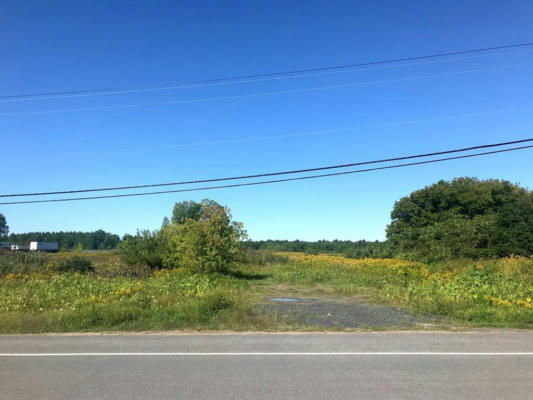
10621 STATE ROUTE 9 # US-9, CHAMPLAIN, NY 12919
$179,000
4Beds
2Baths
1,526Sq Ft
Listing by Donald Duley & Associates
214 TALLMAN RD, CHAMPLAIN, NY 12919
$224,900
3Beds
2Baths
1,404Sq Ft
Listing by Kavanaugh Realty-Plattsburgh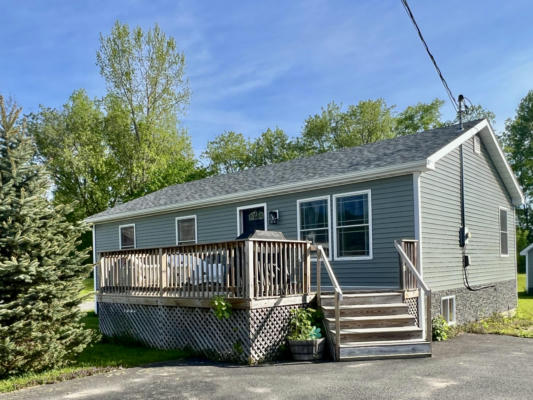
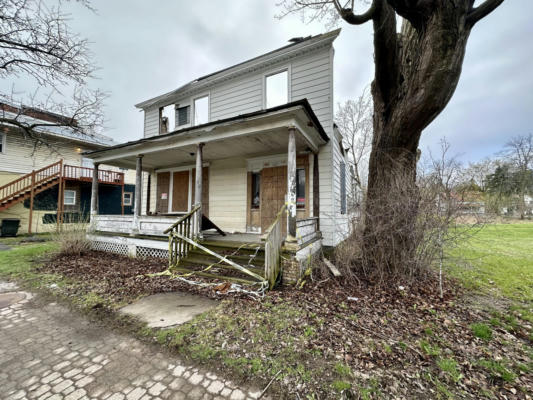
11264 STATE ROUTE 9, CHAMPLAIN, NY 12919
$199,000
4Beds
1Baths
2,000Sq Ft
Listing by RE/MAX North Country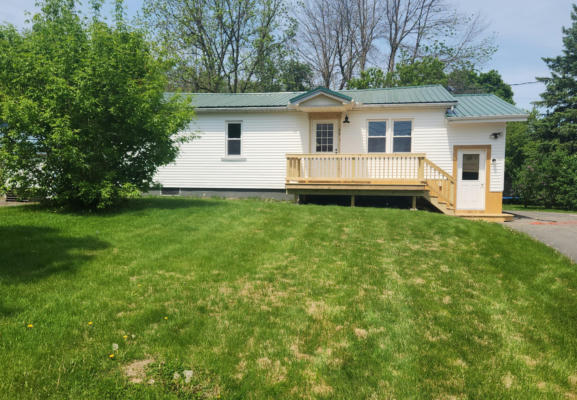
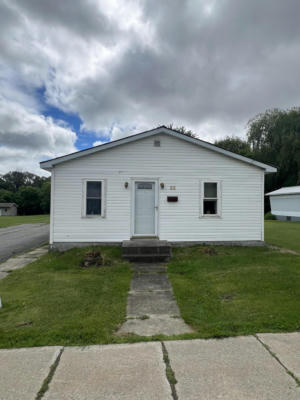
25 BUTTERNUT ST, CHAMPLAIN, NY 12919
$150,000
4Beds
2Baths
1,595Sq Ft
Listing by Kavanaugh Realty-Plattsburgh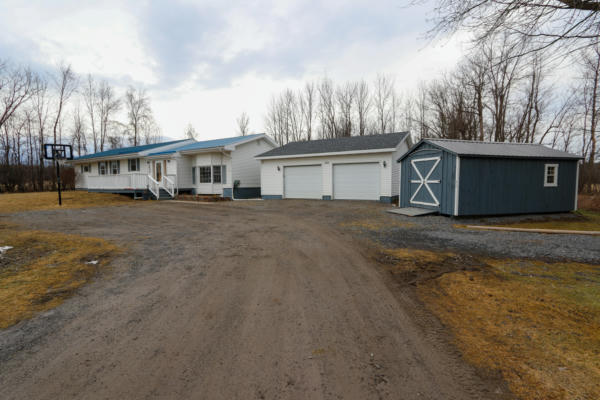
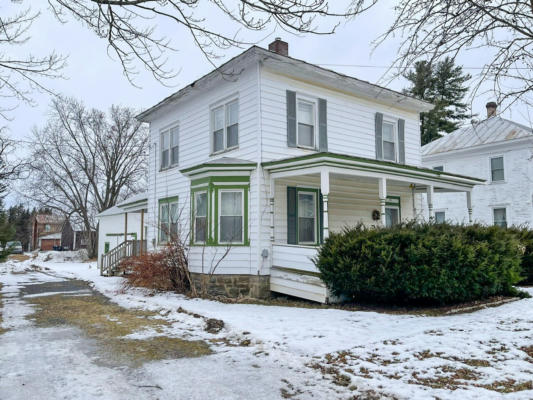
516 PROSPECT ST, CHAMPLAIN, NY 12919
$235,000
3Beds
1Baths
1,612Sq Ft
Listing by Kavanaugh Realty-Plattsburgh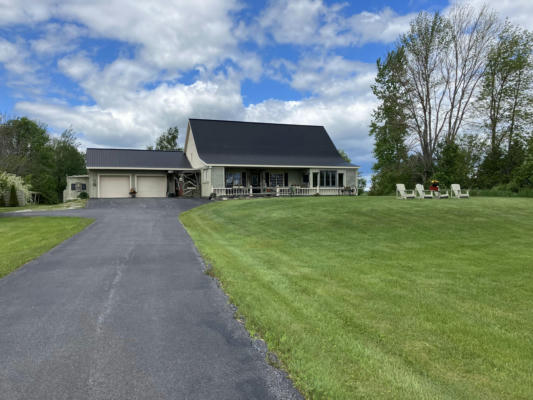
814 STATE ROUTE 9B, CHAMPLAIN, NY 12919
$469,900
3Beds
3Baths
2,304Sq Ft
Listing by eXp Realty-Schenectady


| Cities | Total Listings | Avg. List Price |
|---|---|---|
| 1. New York, NY | 19,802 | $830,427 |
| 2. Queens, NY | 9,196 | $742,008 |
| 3. Brooklyn, NY | 4,736 | $1,081,707 |
| 4. Staten Island, NY | 2,891 | $811,912 |
| 5. Bronx, NY | 2,072 | $556,886 |
| 6. Rochester, NY | 1,606 | $191,617 |
| 7. Flushing, NY | 1,439 | $756,290 |
| 8. North Hempstead, NY | 1,225 | $1,439,160 |
| 9. Buffalo, NY | 1,201 | $209,655 |
| 10. Manhattan, NY | 919 | $1,516,475 |
Total Listings and Average List Price are calculated by RE/MAX, LLC based on active residential listings provided by relevant MLS boards. While MLS data is believed to be reliable, it cannot be guaranteed. MLS data is constantly being updated, making any analysis a snapshot at a particular time.