13813 Real Estate and Homes for Sale
9 results
Sort:
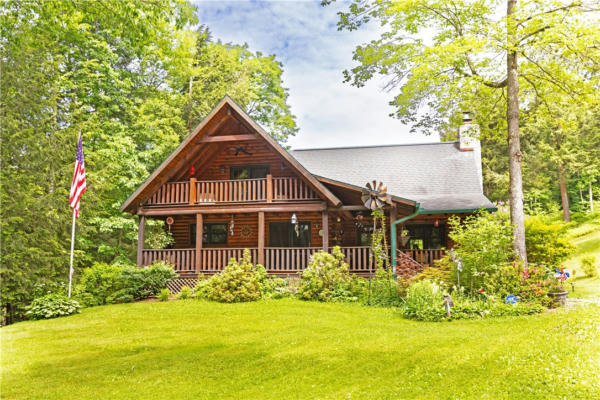
120 THORN HILL RD, NINEVEH, NY 13813
$1,900,000
4Beds
3Baths
1,905Sq Ft
Listing by Coldwell Banker Timberland Properties – R1541089

187, 191 & 192 PERCH POND ROAD ROAD, NINEVEH, NY 13813
$250,000
-Beds
0Baths
N/ASq Ft
Listing by NEXTHOME KINGDOM
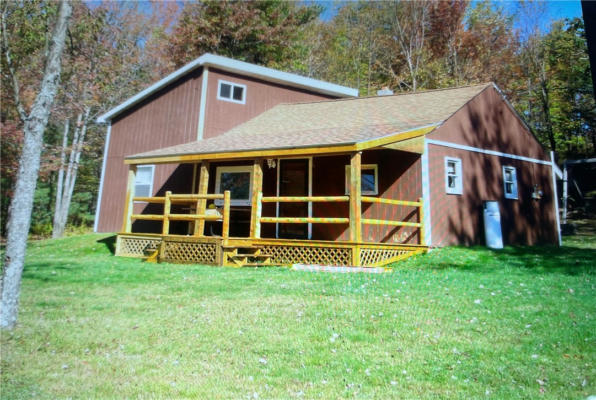
147 PERRY RD, NINEVEH, NY 13813
$249,900
4Beds
2Baths
1,800Sq Ft
Listing by Exit Realty Front & Center – R1542344
355 LORD RD, NINEVEH, NY 13813
$39,900
-Beds
0Baths
6.00Acres
Listing by The Greene Realty Group – B1539749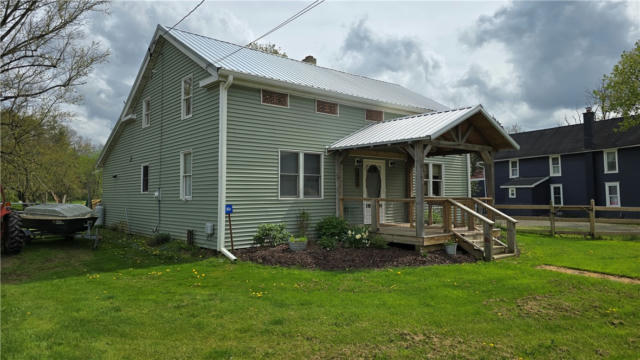
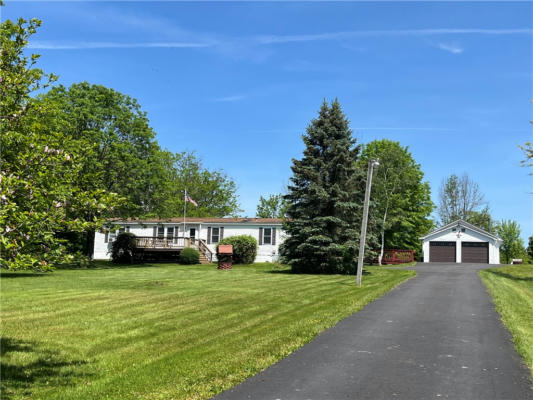
3016 STATE ROUTE 7, NINEVEH, NY 13813
$279,000
4Beds
4Baths
2,264Sq Ft
Listing by Keller Williams Upstate NY Properties – R1516955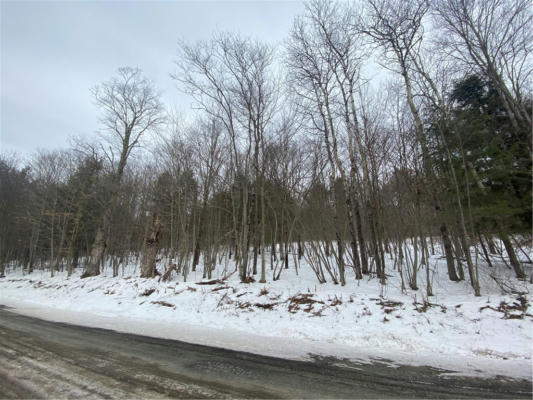
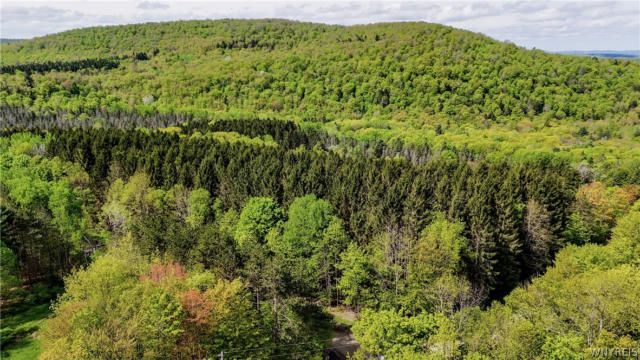
445 HAWKINS RD, NINEVEH, NY 13813
$45,000
-Beds
0Baths
19.75Acres
Listing by EXIT Realty Homeward Bound – R1460727
| Cities | Total Listings | Avg. List Price |
|---|---|---|
| 1. New York, NY | 19,802 | $830,427 |
| 2. Queens, NY | 9,196 | $742,008 |
| 3. Brooklyn, NY | 4,736 | $1,081,707 |
| 4. Staten Island, NY | 2,891 | $811,912 |
| 5. Bronx, NY | 2,072 | $556,886 |
| 6. Rochester, NY | 1,606 | $191,617 |
| 7. Flushing, NY | 1,439 | $756,290 |
| 8. North Hempstead, NY | 1,225 | $1,439,160 |
| 9. Buffalo, NY | 1,201 | $209,655 |
| 10. Manhattan, NY | 919 | $1,516,475 |
Total Listings and Average List Price are calculated by RE/MAX, LLC based on active residential listings provided by relevant MLS boards. While MLS data is believed to be reliable, it cannot be guaranteed. MLS data is constantly being updated, making any analysis a snapshot at a particular time.