
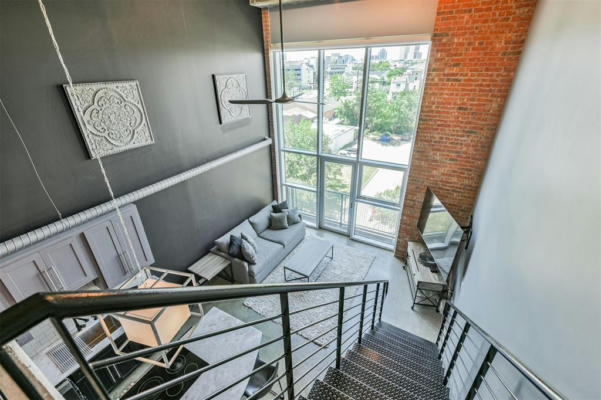
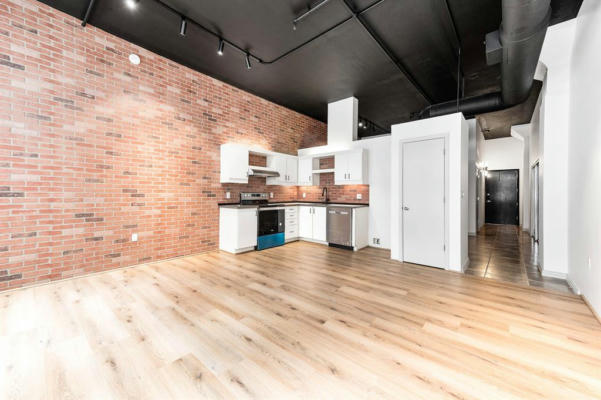
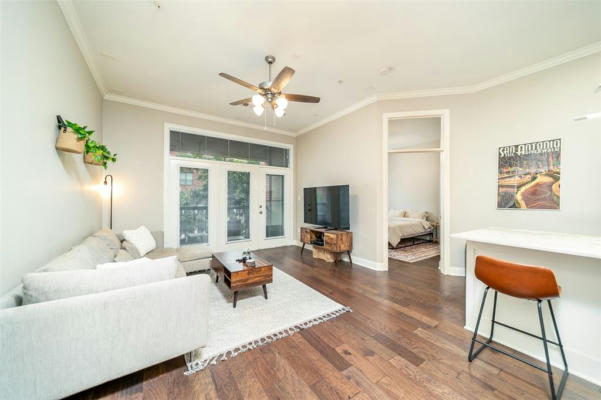
2016 MAIN ST APT 1603, HOUSTON, TX 77002
$169,950
1Beds
1Baths
714Sq Ft
Listing by Homes Central Real Estate, Inc
Sort:
New Listing
1Beds
1Baths
714Sq Ft
New Listing
1Beds
1Baths
1,329Sq Ft
Virtual Tour
New Listing
1Beds
1Baths
557Sq Ft
New Listing
1Beds
1Baths
799Sq Ft
Use arrows to control slideshow
New Listing
1Beds
2Baths
878Sq Ft

Use arrows to control slideshow
New Listing
2Beds
2Baths
1,344Sq Ft
Use arrows to control slideshow
Pending
New Listing
3Beds
3Baths
2,285Sq Ft
Use arrows to control slideshow
New Listing
-Beds
0Baths
N/ASq Ft

Use arrows to control slideshow
New Listing
1Beds
1Baths
851Sq Ft

Use arrows to control slideshow
New Listing
2Beds
3Baths
1,818Sq Ft
Use arrows to control slideshow
Pending
New Listing
2Beds
2Baths
1,468Sq Ft
New Listing
3Beds
3Baths
2,700Sq Ft

Use arrows to control slideshow
Pending
New Listing
1Beds
1Baths
586Sq Ft
Use arrows to control slideshow
New Listing
1Beds
1Baths
784Sq Ft

Use arrows to control slideshow
New Listing
1Beds
2Baths
1,179Sq Ft
Use arrows to control slideshow
New Listing
1Beds
1Baths
698Sq Ft
Use arrows to control slideshow
New Listing
Updated
1Beds
1Baths
1,015Sq Ft

Use arrows to control slideshow
New Listing
1Beds
1Baths
737Sq Ft
Use arrows to control slideshow
New Listing
1Beds
2Baths
975Sq Ft
New Listing
2Beds
4Baths
1,305Sq Ft

Use arrows to control slideshow
New Listing
1Beds
1Baths
697Sq Ft
Use arrows to control slideshow
New Listing
2Beds
2Baths
1,208Sq Ft
Use arrows to control slideshow
New Listing
1Beds
1Baths
834Sq Ft

Use arrows to control slideshow
| Cities | Total Listings | Avg. List Price |
|---|---|---|
| 1. Houston, TX | 21,428 | $309,372 |
| 2. San Antonio, TX | 14,658 | $297,906 |
| 3. Austin, TX | 12,445 | $552,867 |
| 4. Northeast Dallas, TX | 7,994 | $530,769 |
| 5. Northwest Harris, TX | 7,116 | $372,372 |
| 6. Dallas, TX | 6,969 | $555,908 |
| 7. Fort Worth, TX | 5,768 | $317,695 |
| 8. Southeast Montgomery, TX | 5,604 | $355,291 |
| 9. El Paso, TX | 5,361 | $261,867 |
| 10. San Antonio Central, TX | 4,348 | $251,649 |
Total Listings and Average List Price are calculated by RE/MAX, LLC based on active residential listings provided by relevant MLS boards. While MLS data is believed to be reliable, it cannot be guaranteed. MLS data is constantly being updated, making any analysis a snapshot at a particular time.