76569 Real Estate and Homes for Sale
31 results
Sort:

8618 HUNT HILL WEST RD, ROGERS, TX 76569
$250,680
-Beds
0Baths
N/ASq Ft
Listing by Magnolia Realty Temple Belton
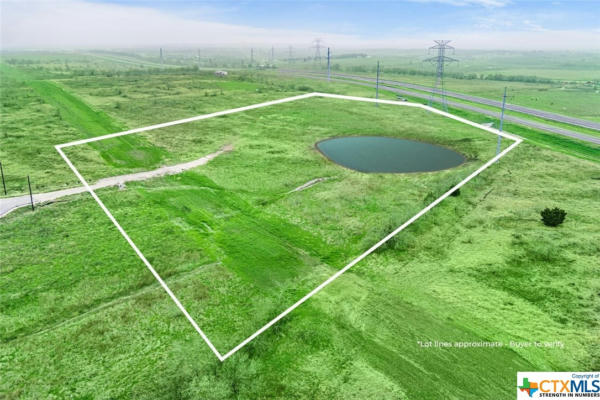
0 FIVE WELLS ROAD, ROGERS, TX 76569
$800,000
-Beds
0Baths
16.08Acres
Listing by All City Real Estate Ltd. Co
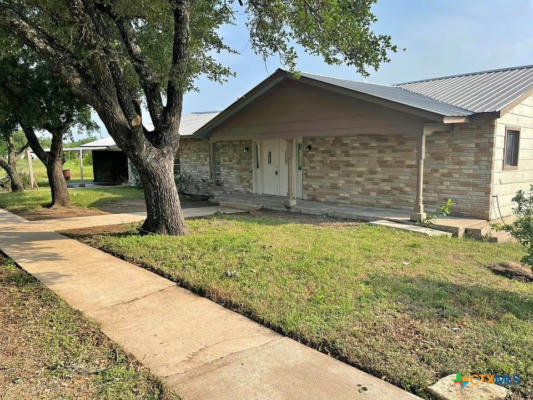
4522 S FM 2184, ROGERS, TX 76569
$2,500,000
0Beds
0Baths
155.16Acres
Listing by Texas Land Associates Inc. – Luke Rogers
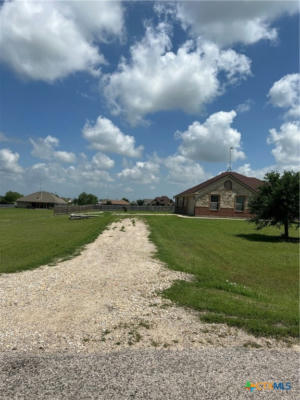
TBD REEDS LAKE ROAD # A, ROGERS, TX 76569
$150,000
-Beds
0Baths
N/ASq Ft
Listing by Magnolia Realty Temple Belton

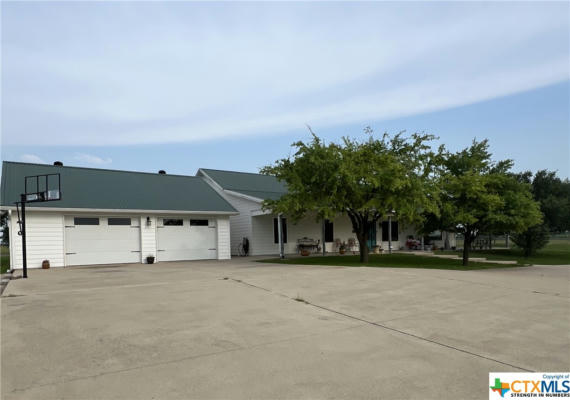
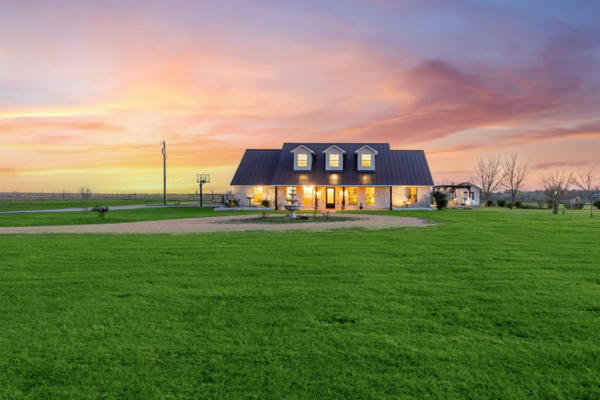
9939 WEDEL CEMETERY RD, ROGERS, TX 76569
$1,200,000
3Beds
2Baths
3,971Sq Ft
Listing by Sojourn Real Estate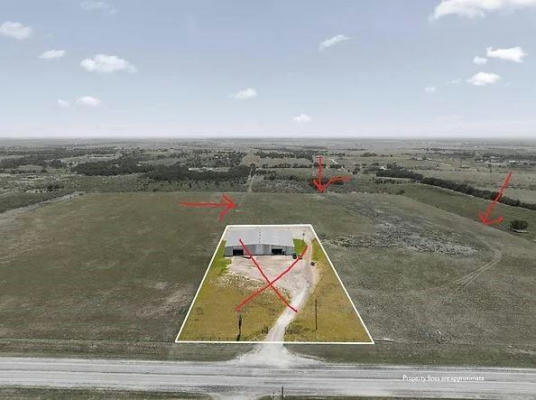
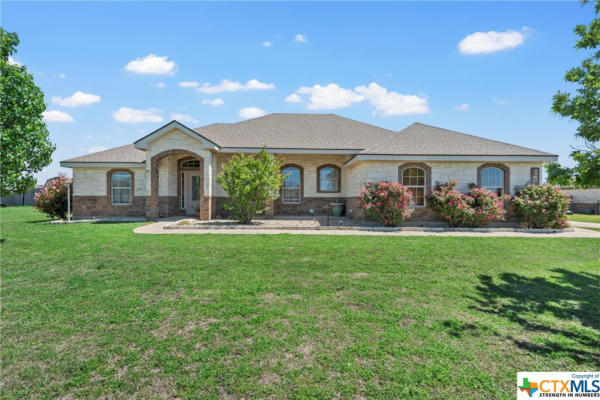
2025 SUN CIR, ROGERS, TX 76569
$389,000
4Beds
2Baths
1,694Sq Ft
Listing by Hearthstone Home Group- All Ci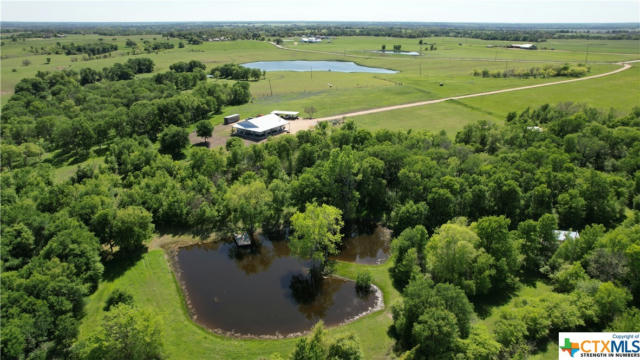
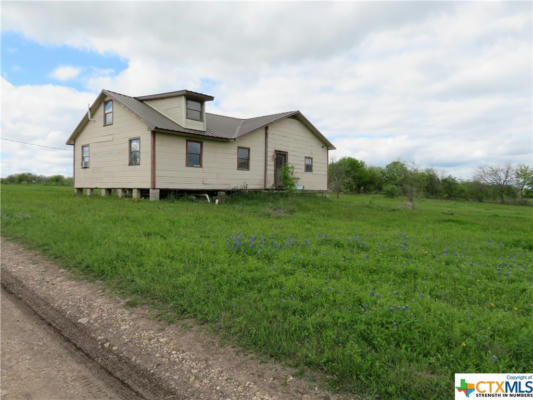
15586 SYPERT BRANCH RD, ROGERS, TX 76569
$175,000
3Beds
2Baths
2,171Sq Ft
Listing by RE/MAX Temple Belton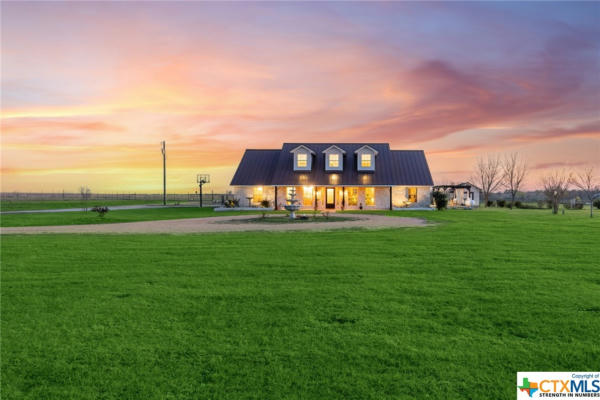
13487 WEDEL CEMETERY RD, ROGERS, TX 76569
$450,000
4Beds
2Baths
1,848Sq Ft
Listing by Magnolia Realty Temple Belton

| Cities | Total Listings | Avg. List Price |
|---|---|---|
| 1. Houston, TX | 21,428 | $309,372 |
| 2. San Antonio, TX | 14,658 | $297,906 |
| 3. Austin, TX | 12,445 | $552,867 |
| 4. Northeast Dallas, TX | 7,994 | $530,769 |
| 5. Northwest Harris, TX | 7,116 | $372,372 |
| 6. Dallas, TX | 6,969 | $555,908 |
| 7. Fort Worth, TX | 5,768 | $317,695 |
| 8. Southeast Montgomery, TX | 5,604 | $355,291 |
| 9. El Paso, TX | 5,361 | $261,867 |
| 10. San Antonio Central, TX | 4,348 | $251,649 |
Total Listings and Average List Price are calculated by RE/MAX, LLC based on active residential listings provided by relevant MLS boards. While MLS data is believed to be reliable, it cannot be guaranteed. MLS data is constantly being updated, making any analysis a snapshot at a particular time.