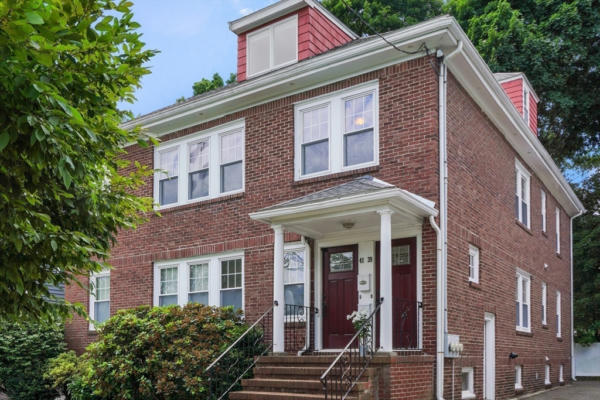
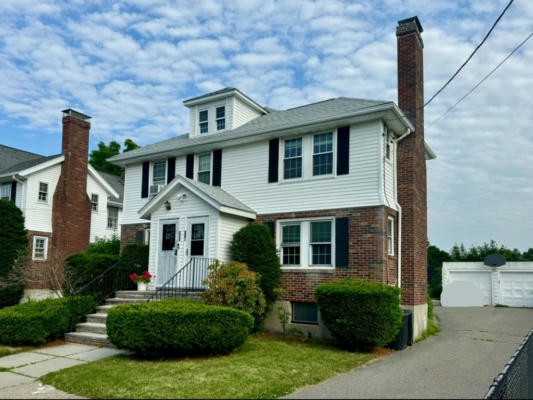
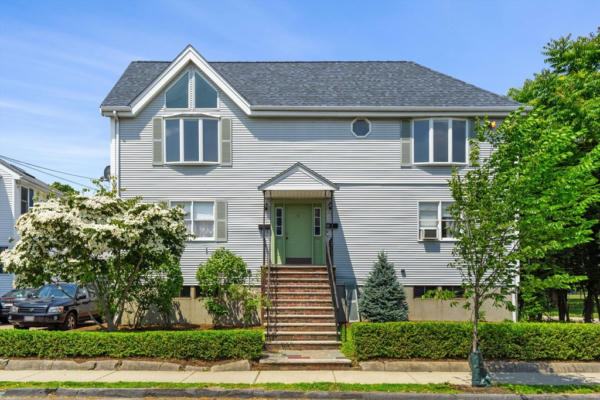
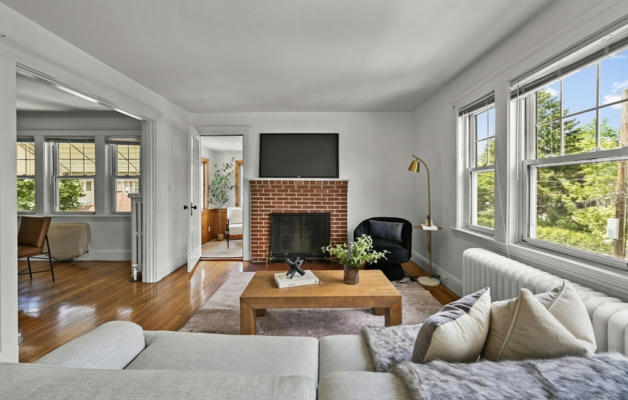
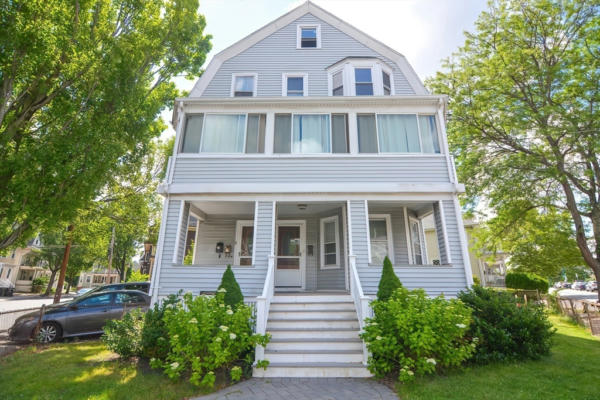
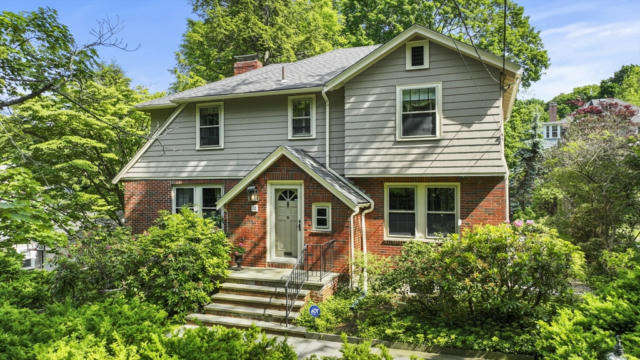
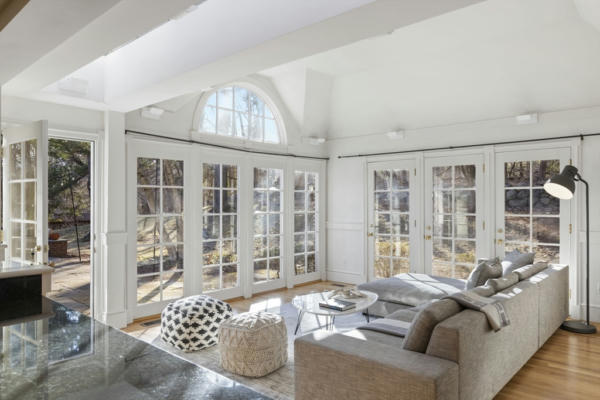
39 CHANNING RD # 2, BELMONT, MA 02478
$879,000
4Beds
2Baths
1,919Sq Ft
Listing by Gibson Sotheby's International Realty – Dave Ledwig
Sort:
Use arrows to control slideshow
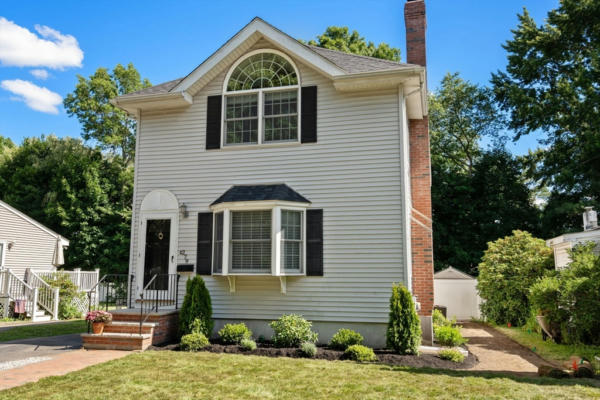
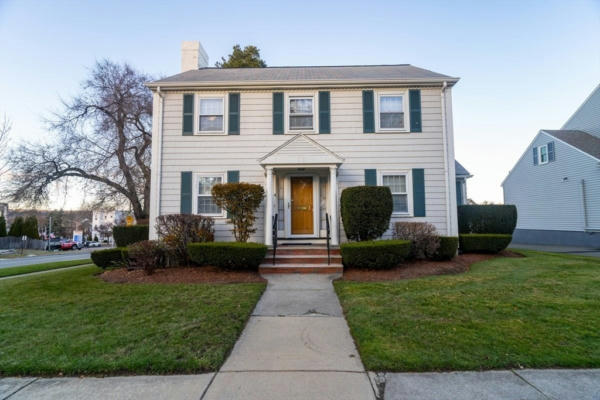
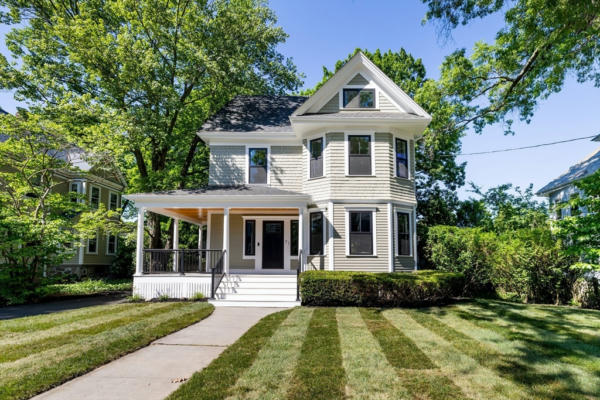
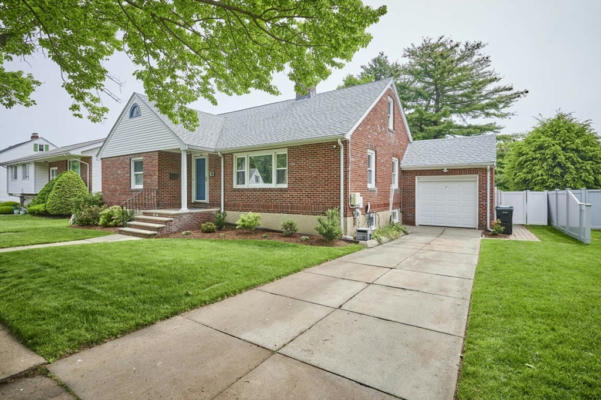
New Listing
4Beds
2Baths
1,919Sq Ft
Use arrows to control slideshow
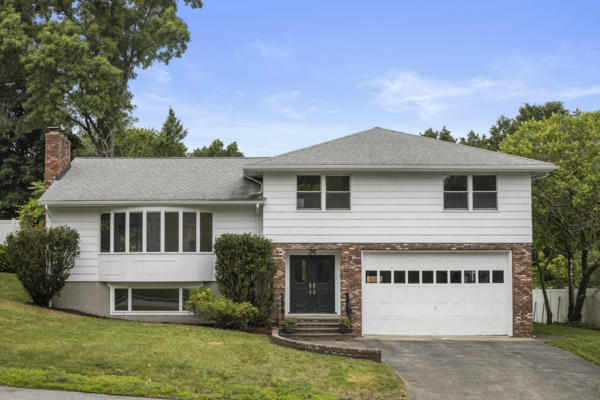
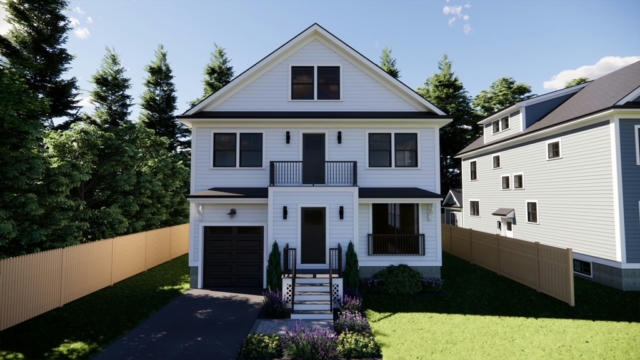
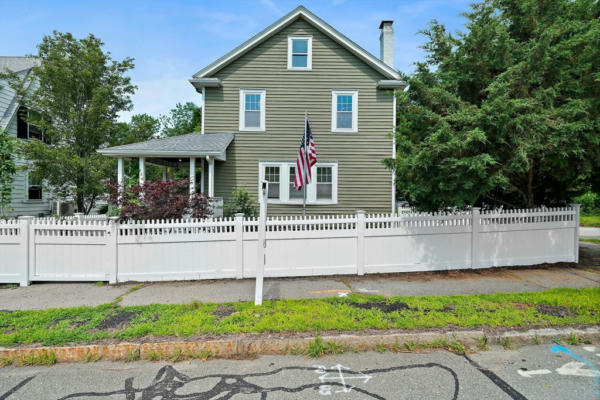
Open House
New Listing
3Beds
4Baths
1,806Sq Ft
Use arrows to control slideshow
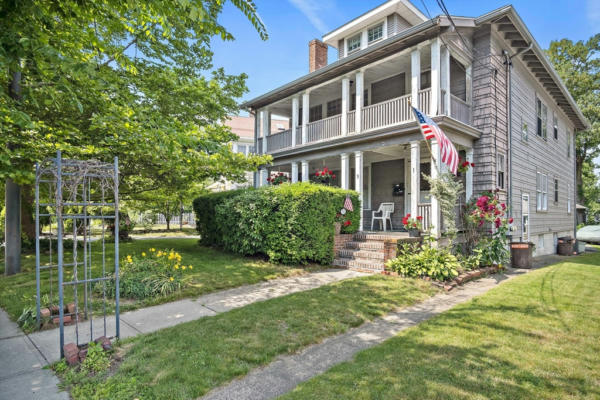
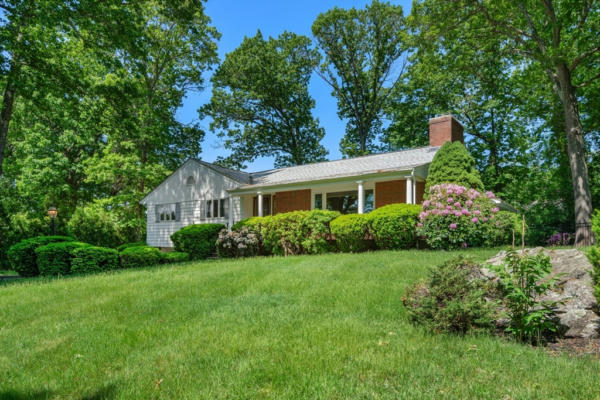
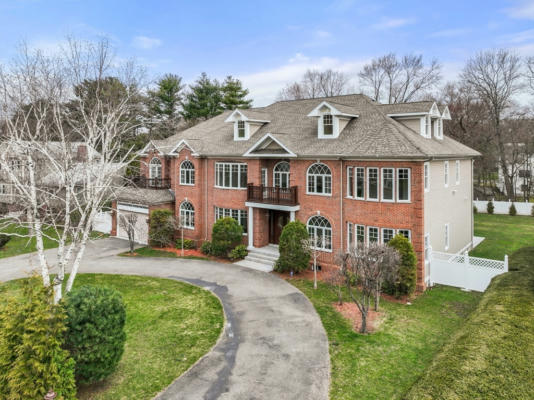
Open House
New Listing
3Beds
3Baths
1,700Sq Ft
Use arrows to control slideshow
New Listing
5Beds
2Baths
2,638Sq Ft
Use arrows to control slideshow
New Listing
3Beds
1Baths
1,323Sq Ft
Use arrows to control slideshow
New Listing
5Beds
5Baths
3,078Sq Ft
Use arrows to control slideshow
Open House
New Listing
5Beds
2Baths
2,976Sq Ft
Use arrows to control slideshow
Open House
New Listing
3Beds
3Baths
1,990Sq Ft
Use arrows to control slideshow
3D Virtual Tour
New Listing
3Beds
2Baths
2,006Sq Ft
Use arrows to control slideshow
Under Contract
New Listing
2Beds
1Baths
1,100Sq Ft
Use arrows to control slideshow
3D Virtual Tour
New Listing
3Beds
4Baths
2,979Sq Ft
Use arrows to control slideshow
Under Contract
New Listing
5Beds
3Baths
4,008Sq Ft
Use arrows to control slideshow
New Listing
2Beds
1Baths
1,308Sq Ft
Use arrows to control slideshow
New Listing
3Beds
2Baths
2,008Sq Ft
New Listing
5Beds
5Baths
3,745Sq Ft
Use arrows to control slideshow
Open House
3D Virtual Tour
4Beds
3Baths
3,944Sq Ft
Use arrows to control slideshow
New Listing
Updated
4Beds
3Baths
2,316Sq Ft
Use arrows to control slideshow
Open House
3D Virtual Tour
4Beds
4Baths
3,065Sq Ft
Use arrows to control slideshow
New Listing
Updated
2Beds
1Baths
748Sq Ft
Use arrows to control slideshow
Open House
New Listing
4Beds
3Baths
2,015Sq Ft
Use arrows to control slideshow
New Listing
6Beds
5Baths
6,183Sq Ft
Use arrows to control slideshow
New Listing
5Beds
3Baths
2,817Sq Ft
Use arrows to control slideshow
Under Contract
New Listing
3Beds
3Baths
1,911Sq Ft
Use arrows to control slideshow
6Beds
8Baths
10,925Sq Ft
| Cities | Total Listings | Avg. List Price |
|---|---|---|
| 1. Boston, MA | 3,940 | $651,893 |
| 2. Cambridge, MA | 502 | $660,435 |
| 3. South Boston, MA | 434 | $446,488 |
| 4. Dorchester, MA | 410 | $211,557 |
| 5. Newton, MA | 385 | $1,343,280 |
| 6. Barnstable Town, MA | 381 | $1,699,351 |
| 7. Brookline, MA | 378 | $1,113,312 |
| 8. Brighton, MA | 366 | $198,614 |
| 9. Somerville, MA | 337 | $628,879 |
| 10. East Boston, MA | 300 | $343,190 |
Total Listings and Average List Price are calculated by RE/MAX, LLC based on active residential listings provided by relevant MLS boards. While MLS data is believed to be reliable, it cannot be guaranteed. MLS data is constantly being updated, making any analysis a snapshot at a particular time.