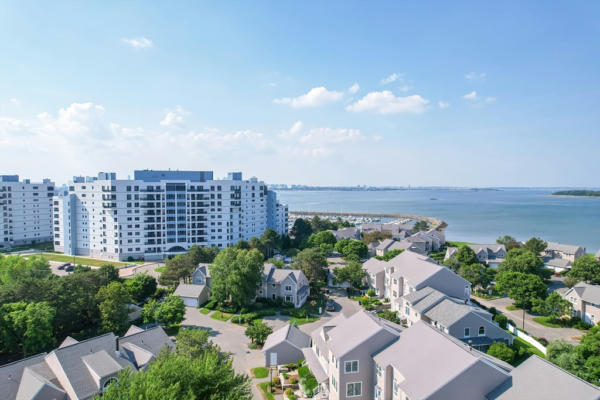
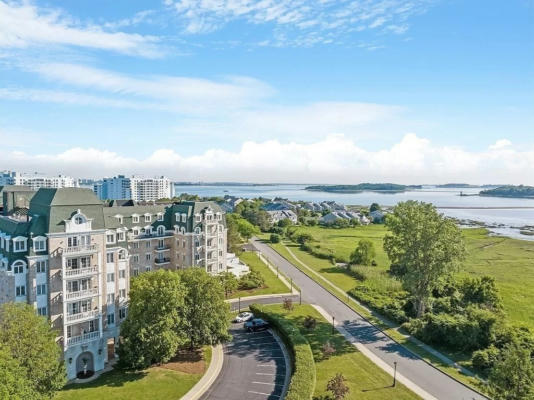
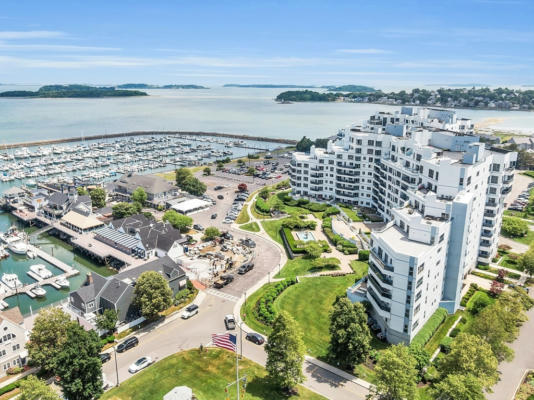
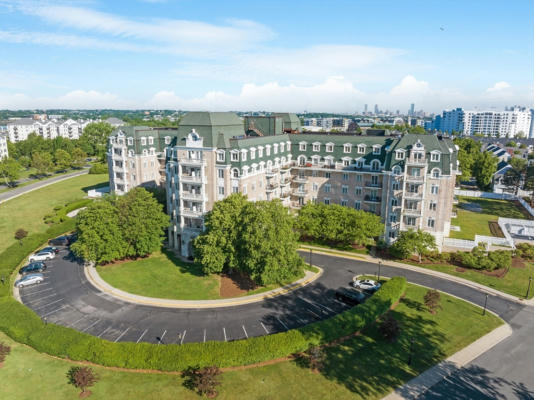
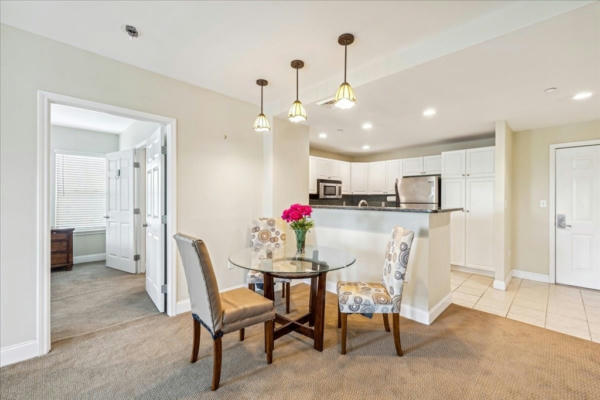
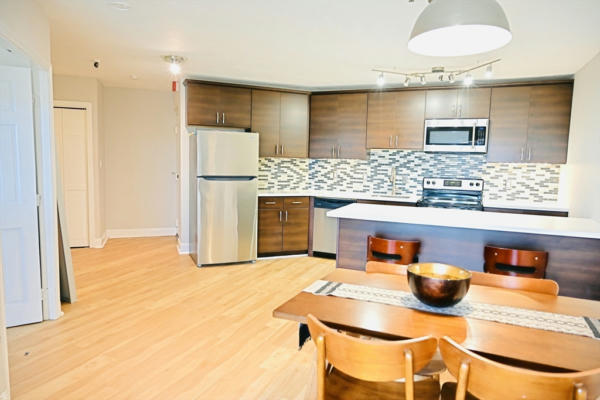
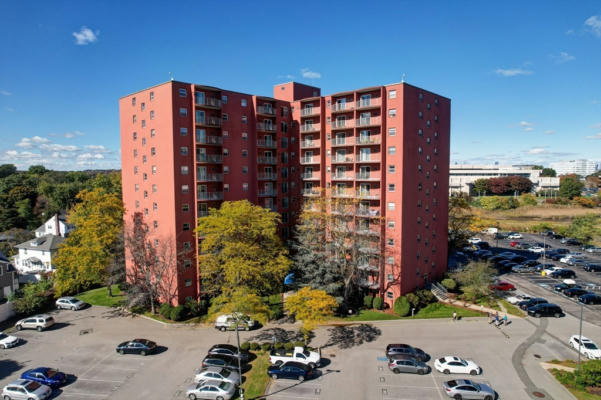
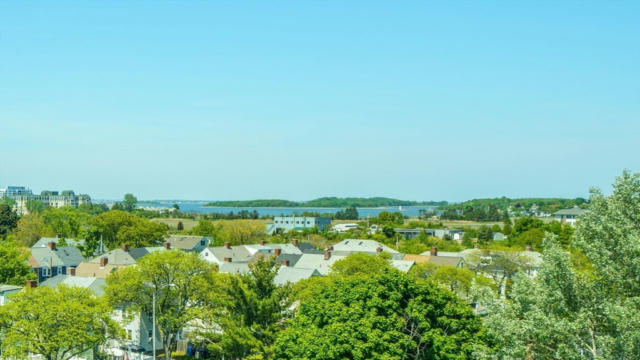
10 SEAPORT DR APT 2207, QUINCY, MA 02171
$550,000
1Beds
1Baths
963Sq Ft
Listing by RE/MAX Harmony – David Ladner
Sort:
Use arrows to control slideshow
Open House
New Listing
1Beds
1Baths
963Sq Ft
Use arrows to control slideshow
Open House
New Listing
2Beds
2Baths
1,341Sq Ft
Use arrows to control slideshow
Open House
New Listing
2Beds
2Baths
1,976Sq Ft
Use arrows to control slideshow
New Listing
2Beds
1Baths
905Sq Ft
New Listing
4Beds
2Baths
1,956Sq Ft
Use arrows to control slideshow
New Listing
2Beds
3Baths
1,714Sq Ft
Use arrows to control slideshow
New Listing
3Beds
2Baths
1,089Sq Ft
Use arrows to control slideshow
New Listing
2Beds
1Baths
808Sq Ft
Use arrows to control slideshow
Open House
New Listing
2Beds
2Baths
1,159Sq Ft
Use arrows to control slideshow
New Listing
3Beds
2Baths
1,560Sq Ft
Use arrows to control slideshow
New Listing
2Beds
3Baths
1,660Sq Ft
Use arrows to control slideshow
Under Contract
New Listing
2Beds
2Baths
1,170Sq Ft
Use arrows to control slideshow
Open House
New Listing
1Beds
1Baths
685Sq Ft
Use arrows to control slideshow
New Listing
1Beds
1Baths
896Sq Ft
Use arrows to control slideshow
Under Contract
New Listing
2Beds
3Baths
1,373Sq Ft
Use arrows to control slideshow
New Listing
2Beds
2Baths
1,787Sq Ft
Use arrows to control slideshow
New Listing
1Beds
1Baths
765Sq Ft
Use arrows to control slideshow
3D Virtual Tour
2Beds
2Baths
1,170Sq Ft
Use arrows to control slideshow
3D Virtual Tour
4Beds
3Baths
2,522Sq Ft
Use arrows to control slideshow
3D Virtual Tour
Updated
3Beds
2Baths
1,676Sq Ft
Use arrows to control slideshow
Updated
6Beds
4Baths
3,601Sq Ft
Use arrows to control slideshow
2Beds
3Baths
1,959Sq Ft
Use arrows to control slideshow
Use arrows to control slideshow
3D Virtual Tour
2Beds
2Baths
1,225Sq Ft
| Cities | Total Listings | Avg. List Price |
|---|---|---|
| 1. Boston, MA | 3,937 | $655,663 |
| 2. Cambridge, MA | 501 | $651,971 |
| 3. South Boston, MA | 430 | $472,397 |
| 4. Dorchester, MA | 406 | $199,280 |
| 5. Newton, MA | 381 | $1,338,436 |
| 6. Barnstable Town, MA | 381 | $1,702,873 |
| 7. Brookline, MA | 375 | $1,130,058 |
| 8. Brighton, MA | 365 | $208,564 |
| 9. Somerville, MA | 336 | $626,765 |
| 10. East Boston, MA | 308 | $341,903 |
Total Listings and Average List Price are calculated by RE/MAX, LLC based on active residential listings provided by relevant MLS boards. While MLS data is believed to be reliable, it cannot be guaranteed. MLS data is constantly being updated, making any analysis a snapshot at a particular time.