12480 Real Estate and Homes for Sale
11 results
Sort:
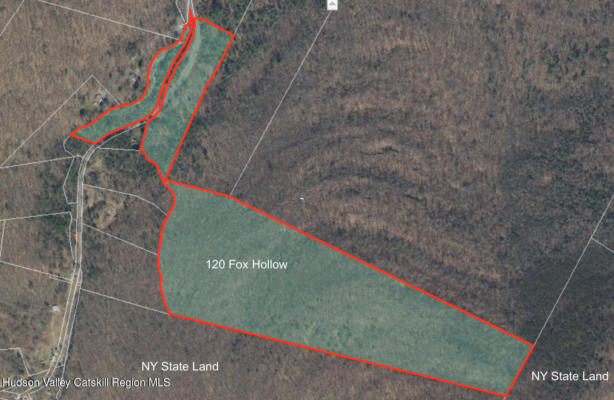
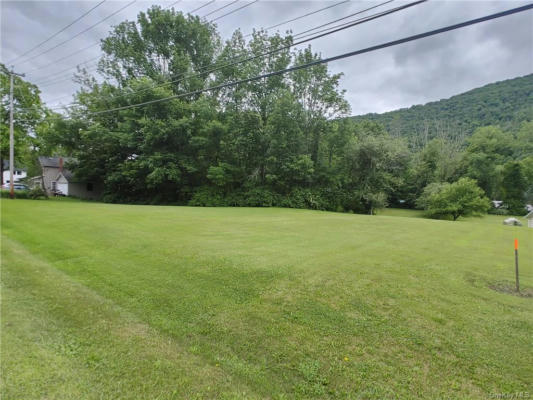
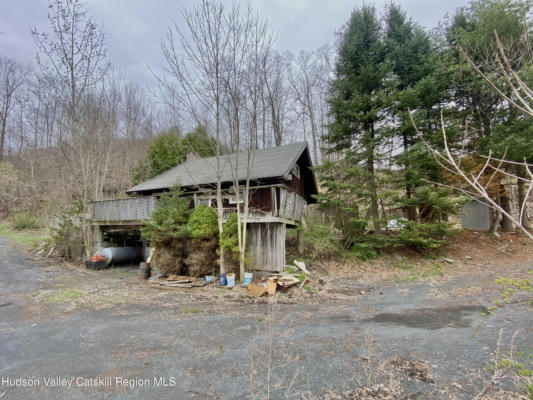
121 FOX HOLLOW RD, SHANDAKEN, NY 12480
$429,000
-Beds
0Baths
N/ASq Ft
Listing by BHHS HUDSON VALLEY PROP-WDST
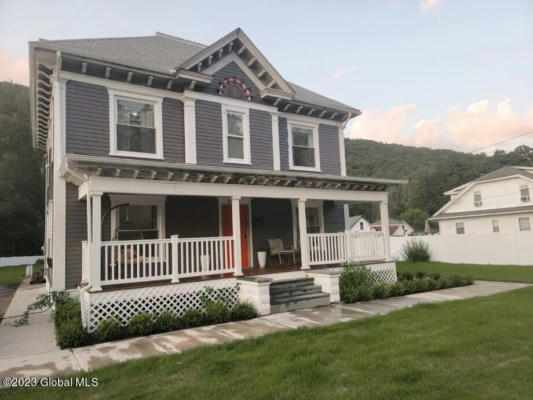
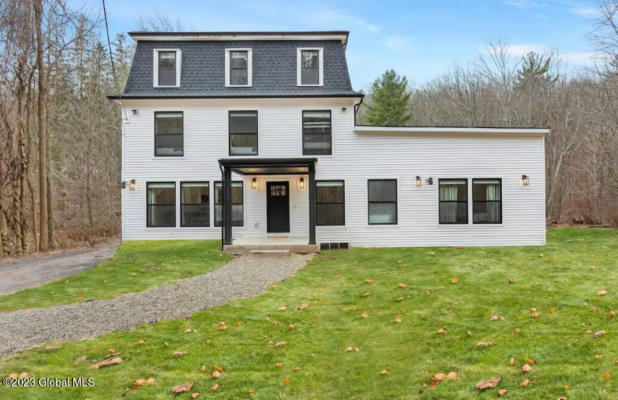
7376 STATE ROUTE 28, SHANDAKEN, NY 12480
$825,000
8Beds
4Baths
2,623Sq Ft
Listing by Oxford Property Group USA – Jamie Sittner
57 BIRCH CREEK ROAD, SHANDAKEN, NY 12480
$950,000
7Beds
3Baths
3,806Sq Ft
Listing by Oxford Property Group USA – Jamie Sittner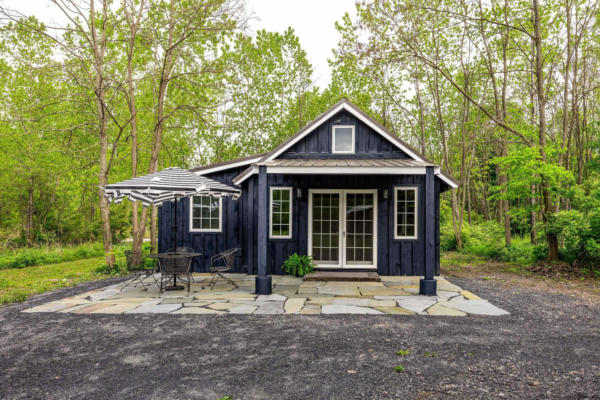
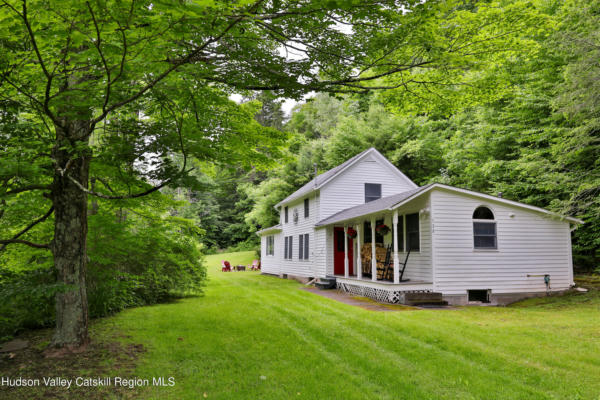
15 DUTCHER RD, SHANDAKEN, NY 12480
$549,000
2Beds
2Baths
1,274Sq Ft
Listing by BHHS HUDSON VALLEY PROP-WDST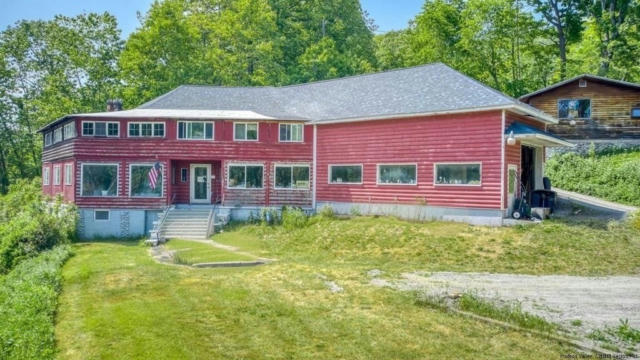
7284 STATE ROUTE 28, SHANDAKEN, NY 12480
$475,000
3Beds
2Baths
6,000Sq Ft
Listing by Keller Williams Realty Hudson Valley North – R1535410
7290 STATE ROUTE 28, SHANDAKEN, NY 12480
$209,900
2Beds
1Baths
1,328Sq Ft
Listing by Gene Rios Realty LLC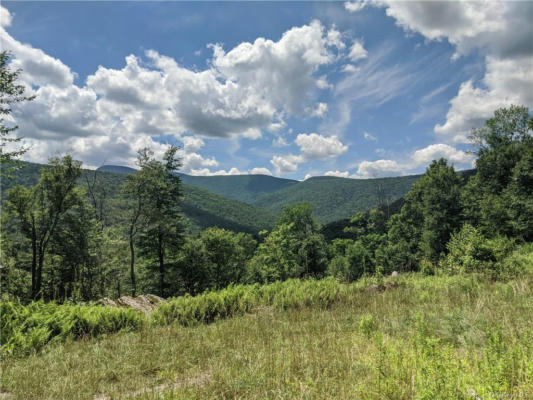
44 LARKIN FARM ROAD, SHANDAKEN, NY 12480
$549,000
-Beds
0Baths
N/ASq Ft
Listing by The Kinderhook Group, Inc.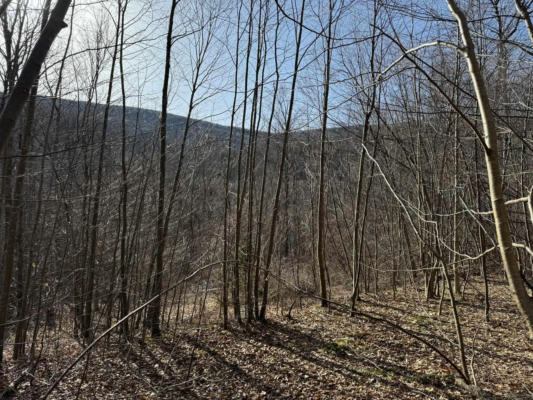
0 ERIKA DRIVE, SHANDAKEN, NY 12480
$190,000
-Beds
0Baths
N/ASq Ft
Listing by Keller Williams Realty HV Nort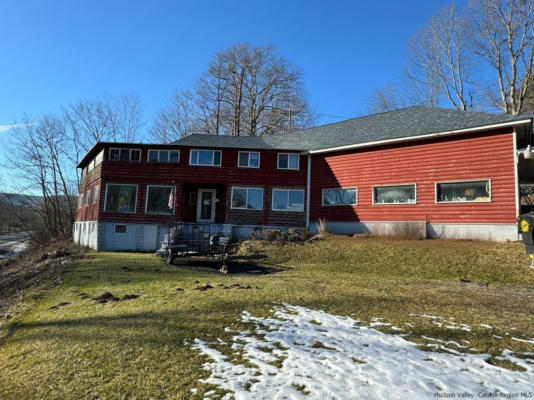
7284 STATE ROUTE 28, SHANDAKEN, NY 12480
$475,000
-Beds
0Baths
N/ASq Ft
Listing by Keller Williams Realty HV Nort
| Cities | Total Listings | Avg. List Price |
|---|---|---|
| 1. New York, NY | 19,802 | $830,427 |
| 2. Queens, NY | 9,196 | $742,008 |
| 3. Brooklyn, NY | 4,736 | $1,081,707 |
| 4. Staten Island, NY | 2,891 | $811,912 |
| 5. Bronx, NY | 2,072 | $556,886 |
| 6. Rochester, NY | 1,606 | $191,617 |
| 7. Flushing, NY | 1,439 | $756,290 |
| 8. North Hempstead, NY | 1,225 | $1,439,160 |
| 9. Buffalo, NY | 1,201 | $209,655 |
| 10. Manhattan, NY | 919 | $1,516,475 |
Total Listings and Average List Price are calculated by RE/MAX, LLC based on active residential listings provided by relevant MLS boards. While MLS data is believed to be reliable, it cannot be guaranteed. MLS data is constantly being updated, making any analysis a snapshot at a particular time.