73048 Real Estate and Homes for Sale
16 results
Sort:


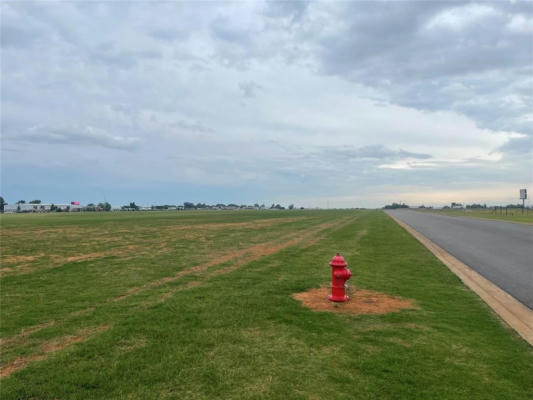
S I-40 FRONTAGE ROAD, WEATHERFORD, OK 73096
$489,000
-Beds
0Baths
N/ASq Ft
Listing by UNITED COUNTRY HEARD AUCTION & RE
S I-40 SERVICE ROAD, WEATHERFORD, OK 73096
$2,250,000
-Beds
0Baths
N/ASq Ft
Listing by UNITED COUNTRY HEARD AUCTION & RE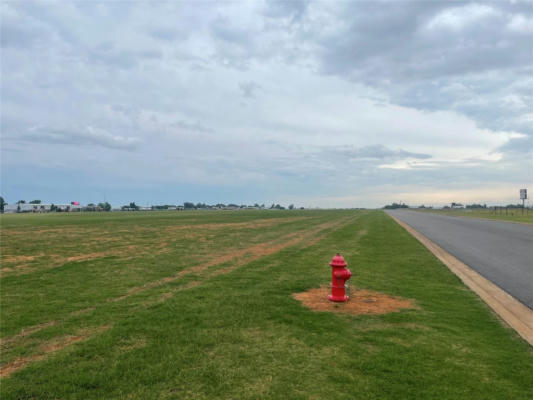

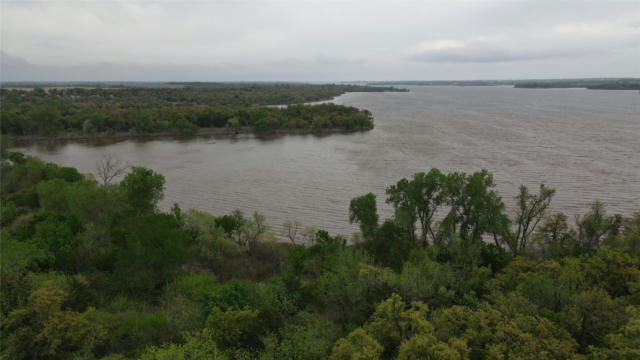
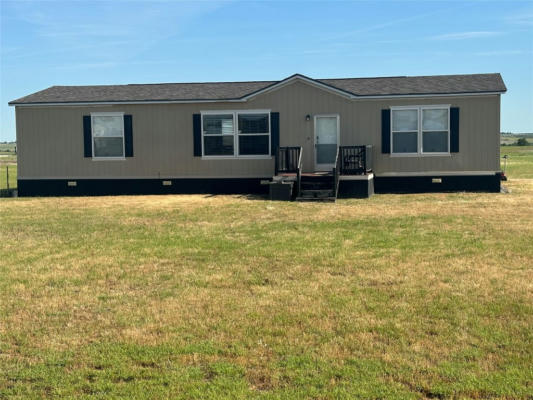
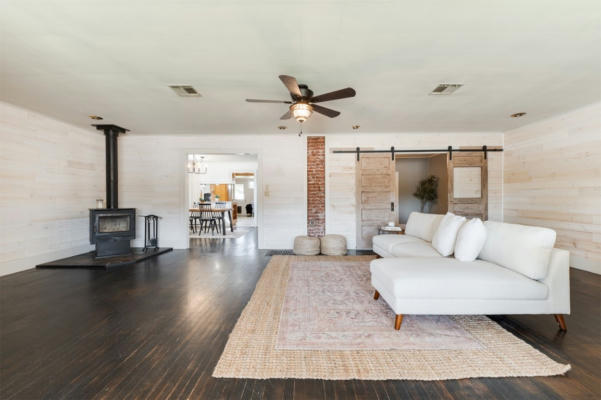
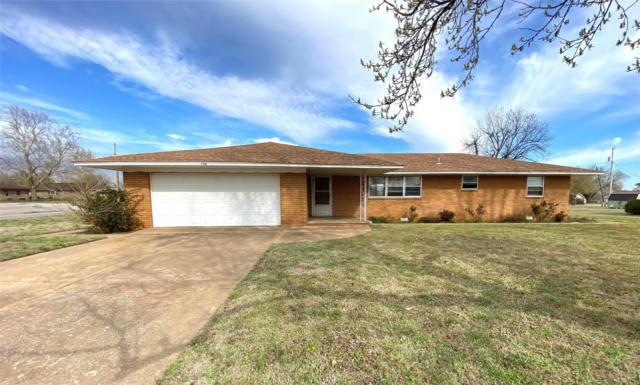
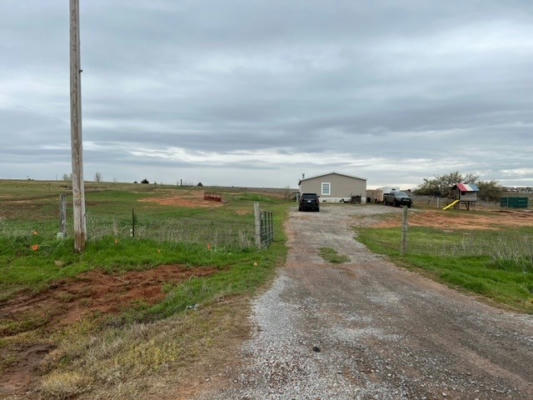
4063 COUNTY STREET 2470, HYDRO, OK 73048
$299,000
3Beds
2Baths
1,888Sq Ft
Listing by CENTRAL WEST REAL ESTATE
| Cities | Total Listings | Avg. List Price |
|---|---|---|
| 1. Oklahoma City, OK | 4,395 | $330,158 |
| 2. Oklahoma City Southwest, OK | 2,007 | $318,025 |
| 3. Tulsa, OK | 1,859 | $334,286 |
| 4. Edmond, OK | 1,541 | $439,207 |
| 5. East Canadian, OK | 1,374 | $323,909 |
| 6. Oklahoma City Northwest, OK | 1,297 | $439,488 |
| 7. Broken Bow, OK | 1,176 | $478,169 |
| 8. Norman, OK | 971 | $316,711 |
| 9. Broken Arrow, OK | 952 | $381,320 |
| 10. Yukon, OK | 908 | $323,745 |
Total Listings and Average List Price are calculated by RE/MAX, LLC based on active residential listings provided by relevant MLS boards. While MLS data is believed to be reliable, it cannot be guaranteed. MLS data is constantly being updated, making any analysis a snapshot at a particular time.